Have you already lost a few hours trying to understand why a DXL block was not invoked when it should be? Were you ever forced to decorate your DXL code with a bunch of “print” calls (like back in the 80’s) to find out what are the actual values of the variables and why your "if" condition is not true? Have you ever had to figure out the workflow of a large DXL program made by another DXL developer who left the company since then? Or even made by you some months ago? If you do develop DXL programs, even rarely, you answered Yes to at least one of these questions, if not all of them.
Instead of typing text in an old fashion and poorly designed DOORS built-in editor, you can use the DXL Editor to provide the necessary features one can expect from a decent and modern IDE (syntax highlight, code completion, code navigation, compilation, etc.). Now your next step is to benefit from its natural extension, the DXL Debugger (part of the commercial extension, the DXL Editor Pro). Now you can finally put breakpoints and control the DXL execution flow with step-by-step and variable inspection!
DXL (DOORS eXtension Language) is a scripting language specially developed for IBM Rational® DOORS®.
Prepare the DXL File
First we need to put a DXL file in the DXL Editor workspace:
- Launch the DXL Editor
- Create a new DXL project: File > New > Other… > DXL Project
- Create a new DXL file in this project
- Paste in the file the DXL code attached to this article.
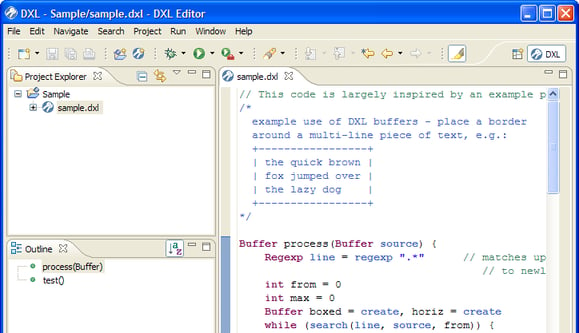
At this point the DXL Editor should look like this:
The DXL file must be part of a DXL Project, in the workspace, so that the debugger can interact with it. Note however that it doesn’t imply it be physically located in the project path. You can reference files outside of the workspace using linked folders. The New DXL Project wizard allows selecting some files or directories to be referenced in the project.
Execute the file
The DXL sample code puts a border around a multi-line piece of text. It is largely inspired by an example provided in the DXL Reference Manual.
Let’s now execute this DXL code:
- Ensure the DOORS client is launched
- In the sample.dxl editor area, right-click Run As > DXL (or use the main menu Run > Run Configurations…)

- A dialog box invites you to select a current module, if needed. A module is not required for this DXL code, so you may check the options Do not set a ‘current’ item and Use this as the default for this file, and do not ask again.
Ouch! DOORS reports a DXL Execution Timeout. Something is wrong in the DXL program. You can confirm the Halt Execution in the DOORS error dialog.
Execution timeouts typically occur within infinite loops. There are two “while” blocks in this DXL code, so we can assume one of them is flawed. Is it time to fully analyze the logic in your head and to print every variable value? Don’t bother my friend, let’s just put some breakpoints!
Debug with breakpoints
Let’s put one breakpoint on line 26 and another on line 51. You just have to right-click Toggle Breakpoint in the editor ruler area, or to double-click in this ruler.

And now let’s execute the code in Debug mode:
- In the sample.dxl editor area, right-click Debug As > DXL (or use the main menu Debug > Debug Configurations…)

- When the first breakpoint is hit (on line 26), a dialog requests to confirm the switch to the Debug perspective, from where you’ll have all the options to monitor the debugged execution.
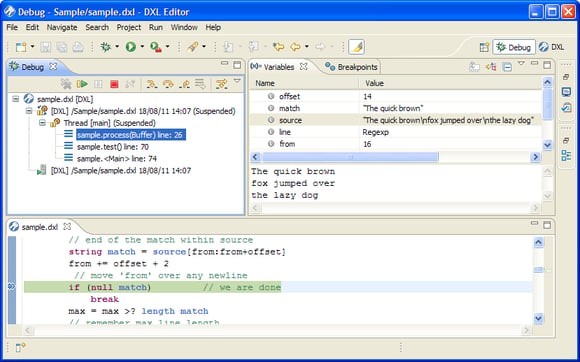
In this Debug perspective, you have the opportunity to understand the current execution state:
- The Debug view shows the current function being executed. It also shows the stack frame, which is the stack of functions that lead to the current function being called. Clicking on one stack element opens the DXL editor on the line that called the corresponding function.
- The Variables view displays information about the variables associated with the selected stack element
- The Breakpoints view lists all the breakpoints you currently have set in your workspace. You can double-click a breakpoint to display its location in the editor.
- From there you can Resume the execution, Stop it, or continue the execution using Steps.
If you resume the execution when the breakpoint on line 26 is hit, you will notice this breakpoint is hit a few times, with variable values being updated accordingly, before the one on line 51 is hit. So that means the first loop is not the guilty one.
Using the second breakpoint (line 51), the Variables view shows that the “boxed” Buffer variable is strangely growing. You also notice that the “from” variable used in the loop condition never gets updated. Et voilà! The cause of the trouble is identified. You can Stop the execution at this point.
Using the Debug perspective, you can Suspend the execution at any time, even if no breakpoint is set… you don’t even have to guess on the possible locations of flawed code.
To fix the code, we just have to insert “from += offset + 2” on line 49. If you Run again the code, the Console view will output the expected result:

Thank you debugger, I owe you one!
Inspect expressions
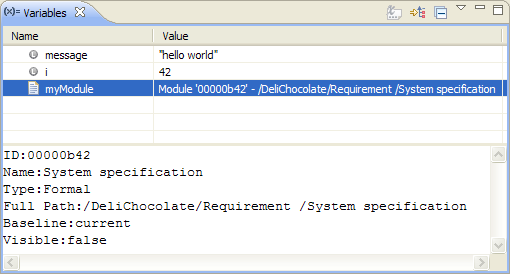
We saw that the Variables view can show the value of each variable. For richer and regularly used types, this view can even show more detailed information. For example, a Module value will not just display its name but a whole set of useful attributes:

However there are cases where this view is not enough to understand the execution state. You may for example want:
- To determine the length of a String and not just see its content.
- To list all the keys of a Skip
- To get the Heading of an Object
- etc.
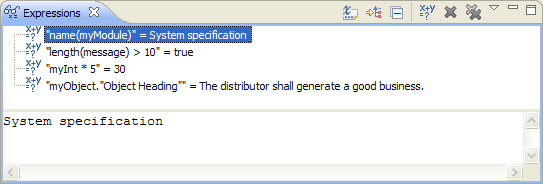
In such case you may use the Expressions or Display views. Both views allow evaluating DXL expressions on variables available in the current function being executed.

Conclusion
The DXL Debugger is a commercial extension of the DXL Editor. It’s not free, but think of the critical amount of time and energy it will save in your daily work. It’s definitely worth it. But don’t just take my word for it: give it a try and see by yourself on your actual DXL programs.
Welcome in the modern DXL programming world!
References
Attachments
Sample DXL File (zipped)


Leave us your comment